

APIs are the backbone of modern software development, connecting different systems and enabling seamless data exchange. However, API development isn't just about machine-to-machine communication; it involves significant human interaction. To bridge this gap, we've introduced JSON visualization in our secure and fast API testing client, Aspen. This feature aims to enhance API understanding and efficiency, making it easier for both developers and non-developers to interact with API data.

Bridging the Gap Between Data and Understanding
The challenge behind this of course is that APIs are primarily concerned with data. Yet data is only useful when it is understood. Like any subject, the more ways we can explain or relay information about a given subject, the easier it is for a larger number of people to approach it. In fact, simply by changing the way we “show” a piece of information can cause interest to go viral. Look no further than “exploring abandoned places” videos on the internet.
There was always a broad fascination with abandoned places, and there were no doubt people who went exploring, but being able to share explorations of abandoned places through video has now fostered an entire global community of abandoned explorers who travel the world to showcase abandoned places online. And likewise, there is now a whole community of abandoned explorer consumers who spend hours watching videos to see what’s behind the next corner.

The Power of Visual Representation in Data Interpretation
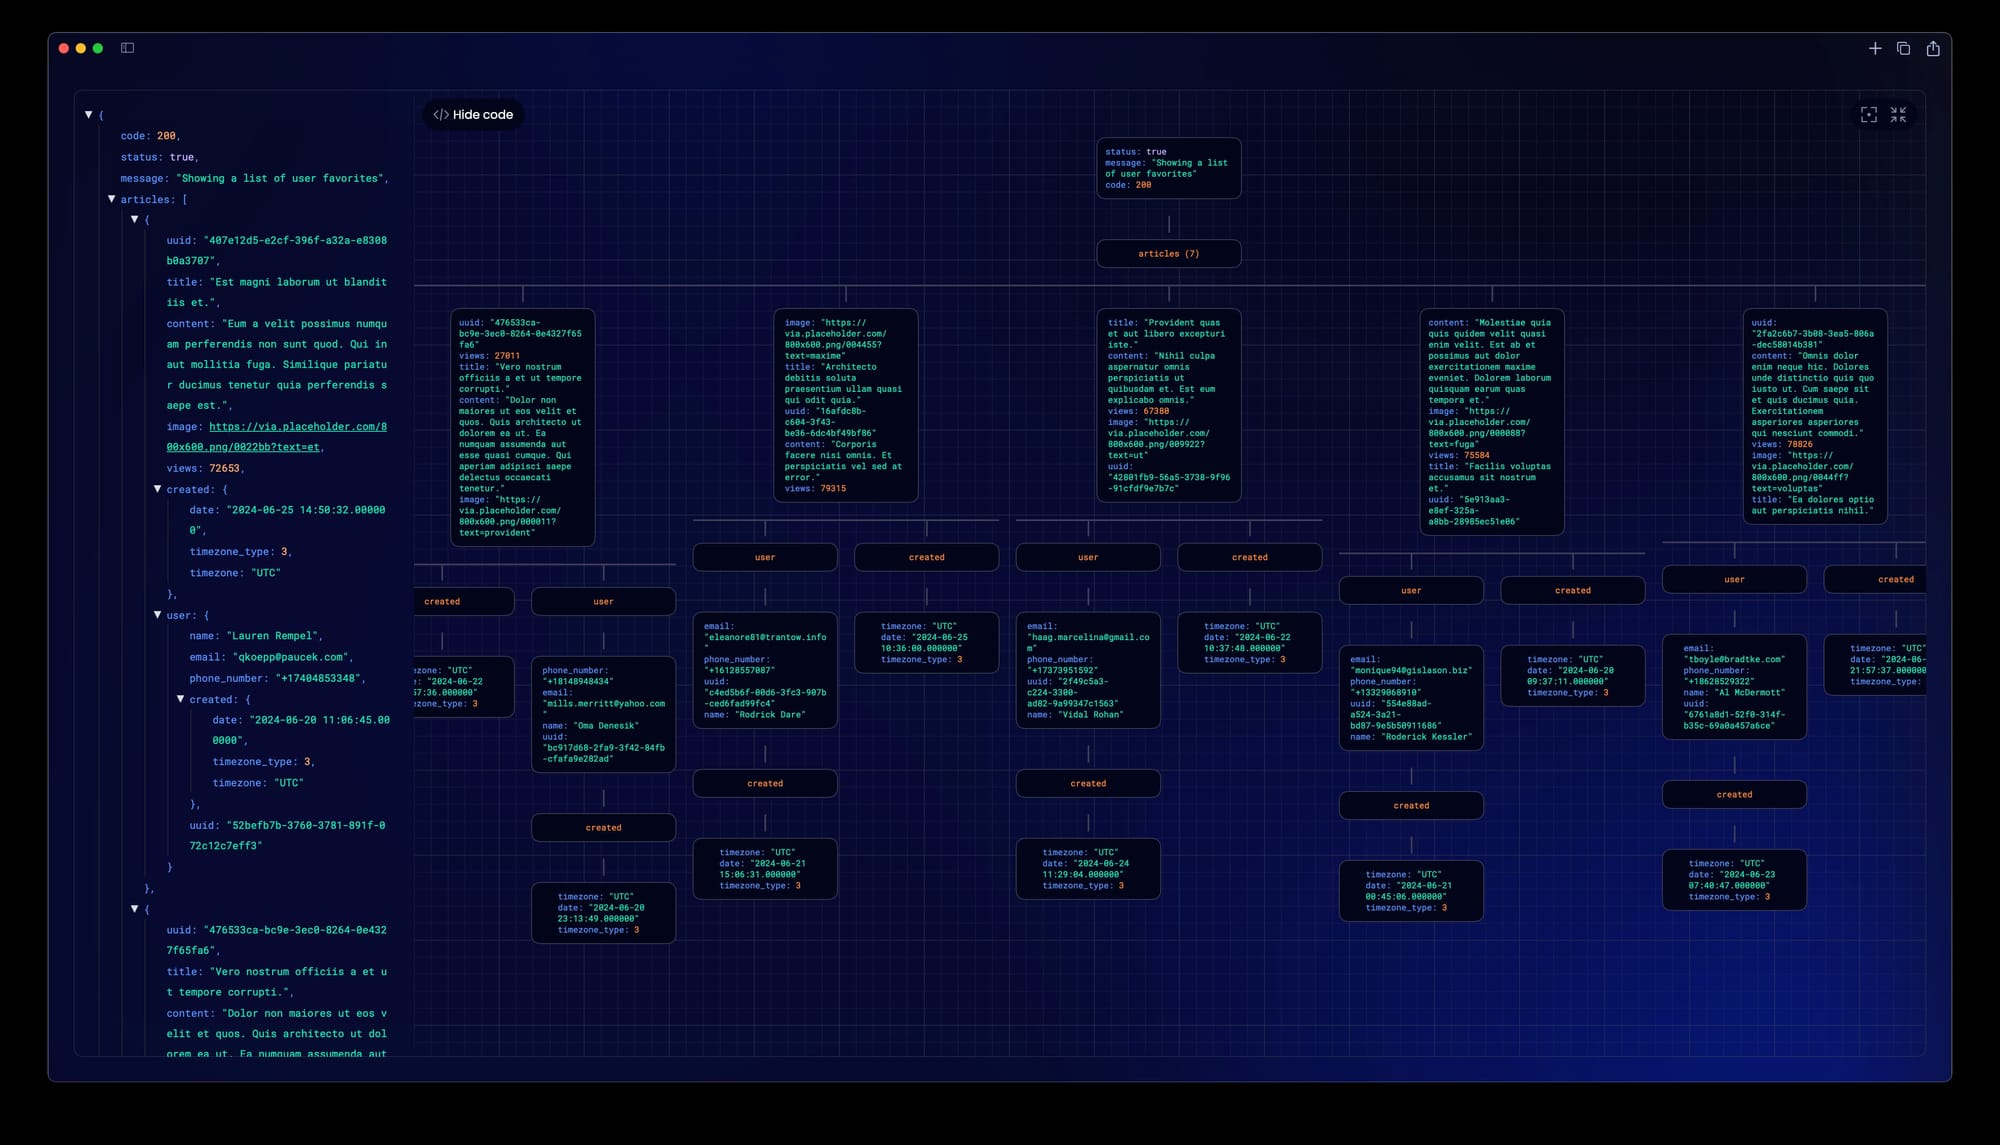
This is why we have added a JSON visualization capability in our free, fast, and completely secure API client, Aspen. With this feature, users can get a visual representation of the returned JSON data for an API call. Like the abandoned places videos, JSON visualization can provide a powerful way to understand the API that reading or looking through raw data does not.
Why JSON Visualization Matters in API Development
Aspen’s JSON Visualization Helps with Understanding
Often, API documentation is either poor or nonexistent, especially for public APIs. Companies often publish their APIs with minimal or outdated documentation, assuming that users will figure it out. However, this leads to significant challenges in understanding and comparing related values, which can be time-consuming and frustrating for users.
Aspen's JSON visualization addresses this by offering a clear, visual representation of API data. This visual approach breaks down complex JSON structures, making it easier for users to grasp the relationships between different data points quickly. By transforming JSON into an intuitive visual format, Aspen helps users understand APIs better without needing to parse through dense and often confusing documentation.
Aspen’s JSON Visualization Helps with Analyzing and Debugging
Another scenario where visualization helps is uncovering issues. Often finding an issue when data is not returned as expected requires digging through rows of JSON to determine the relationship between the data. With this approach, users end up collapsing significant parts of JSON to focus on a subset of data, making it difficult to compare related values.
Aspen's JSON visualization transforms this data into an intuitive, visual format, highlighting high-level relationships and making the data more like a painting on a canvas. Users can quickly identify and understand these relationships, allowing them to drill down into specific areas to find and fix issues faster. This not only speeds up the debugging process but also helps in identifying patterns and anomalies that might be missed in raw JSON data.
Aspen’s JSON Visualization Helps with API Efficiency
Another way visualization can help is when determining if your API response is too complex. For example, when a developer visualizes their JSON, they can more easily determine if resources have been over-nested or if the API response contains too many objects. Addressing issues like these can help create solutions that ultimately allow for better API performance and a better experience for your API consumers. Efficient APIs are easier to maintain, quicker to respond, and more user-friendly, ultimately leading to higher adoption rates and better satisfaction among users.
Saving Time with Aspen's JSON Visualization
In each of the scenarios above, the underlying value is saved time. With Aspen’s JSON visualization, users can understand an API’s response more quickly by seeing it presented in a way that can be more easily digested mentally. It allows you to analyze and debug your API more quickly, since you do not have to go line by line through text to understand the response, particularly with large responses. By reducing complexity and highlighting key relationships within the data, Aspen's JSON visualization empowers users to create more efficient and effective APIs.
Summary of Benefits of JSON Visualization
To summarize, here are the key benefits of using Aspen's JSON visualization:
- Understanding API Data:
- Simplifies complex JSON structures.
- Enhances comprehension of relationships between data points.
- Reduces the need to parse through dense documentation.
- Analyzing and Debugging:
- Identifies issues more quickly.
- Highlights high-level data relationships.
- Speeds up the debugging process by making patterns and anomalies more apparent.
- Optimizing API Efficiency:
- Identifies over-nested resources.
- Simplifies overly complex API responses.
- Improves overall API performance and user experience.
- Saving Time:
- Quickens understanding of API responses.
- Streamlines analysis and troubleshooting.
- Reduces complexity, enabling more efficient API design.
Experience the Benefits of Aspen's JSON Visualization
Designed specifically for developers, data analysts, product managers, and anyone working with structured data formats, this innovative tool offers a tangible way to engage with API data. Whether you are creating presentations, collaborating with teams, or simply trying to understand complex API responses, Aspen's JSON visualization makes the process more intuitive and efficient.
The visualized JSON stays local on your machine, ensuring that your data is secure, fast, and always within your control. Try it out and share your feedback on how Aspen’s JSON visualization enhances your workflow. We're excited to see how you use this feature to simplify and improve your API interactions.


