For every application to work flawlessly, it must have logging in place. It’s a critical component for monitoring, troubleshooting, and maintaining the application’s health. Well-implemented logging can make the difference between quick resolution and hours of debugging.
However, without proper implementation, logging can quickly become a source of noise, performance bottlenecks, or even security vulnerabilities.
With this in mind, I will delve into the essential aspects of logging in .NET APIs showing how to make informed selections of log levels, create structured messages with clear context, and leverage Serilog to improve built in logging framework.
Importance of logging in API development
Without logs, you, as a developer or maintainer, would have no insight into what went wrong within the system. You can only guess what happened and solve something that doesn't exist. This is especially important in the context of security—this deep dive into .NET REST API security covers how crucial proper diagnostics are in detecting vulnerabilities.
That is why logging is not just a "nice-to-have" feature—it's a fundamental aspect of API development.
I would rather see logging as black box - capturing information that is very useful when things go wrong.
And if you have proper logging mechanism in place, you can:
- Reveal exact error messages and stack trace
- Whole context of an error
- Performance metrics around incident (which can be further optimized using these .NET API performance techniques)
- System state in time of failure
Effective logging extends far beyond simply storing and presentation of log information. The structure and organization of your log messages are significant factors to consider in achieving the maximum value and usefulness.
Which leads us to structured logging.
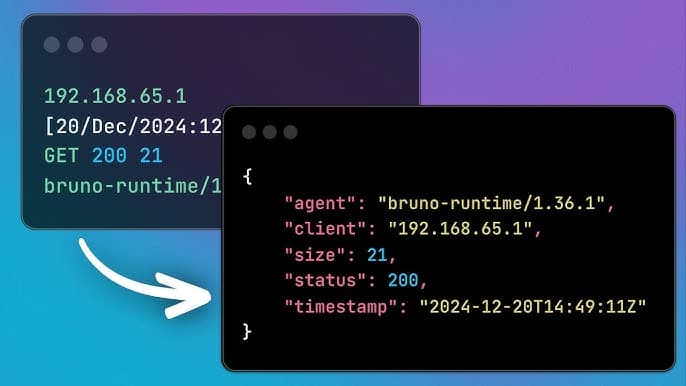
What is structured logging?
Structured logging is a technique where log messages are structured in a consistent format that can be easily read, searched and analyzed.
Source: https://youtu.be/We7s8KFY7Qg
Structured logging is more superior then traditional unstructured logging, because of several advantages:
- A format that machines can efficiently parse: they are stored in formats like JSON, XML or key-value pairs which are easily parsed and processed
- Associated information: addition context is often included in logs like captured events or different metadata
- Queryability: they can be easily queried using different tools allowing you to quickly find specific information
But this approach is not perfect. There are some disadvantages like complex implementation compared to basic logging, and more storage consuming because of additional metadata and information. But, in my personal opinion, their influence is negligible compared to the benefits that are obtained.
.NET logging framework
If you did some logging in .NET, there is a 99.9% chance that you have used the ILogger interface. It has a simple task: to write a log using one of three provided methods: LogInformation, LogError and LogWarrning.
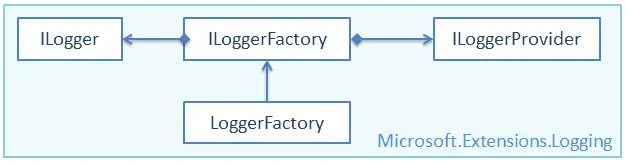
But, he doesn’t work alone. There 3 more core concepts you should know about:
- ILoggerFactory: this interface creates an instance of ILogger and take care of log configuration and providers
- ILoggerProvider: this interface take care of logging provider instances(e.g Console or File)
- LogLevel enums: Levels of log messages (
Trace,Debug,Information,Warning,Error,Critical).
They are all part of Microsoft.Extensions.Logging package that is the official logging framework from Microsoft.
Source: TutorialsTeacher
In Web API projects, the WebApplication class provides default logger configuration. When the host is initialized, it sets up a default configuration that includes, among other things, ILoggerFactory and ILogger with several logging providers registered:
- Console
- Debug
- EventSource
- EventLog (only when running on Windows)
This ensures logging functionality is available by default when the application starts. Let me know if you need further refinements!
Let me show you how this looks in code.
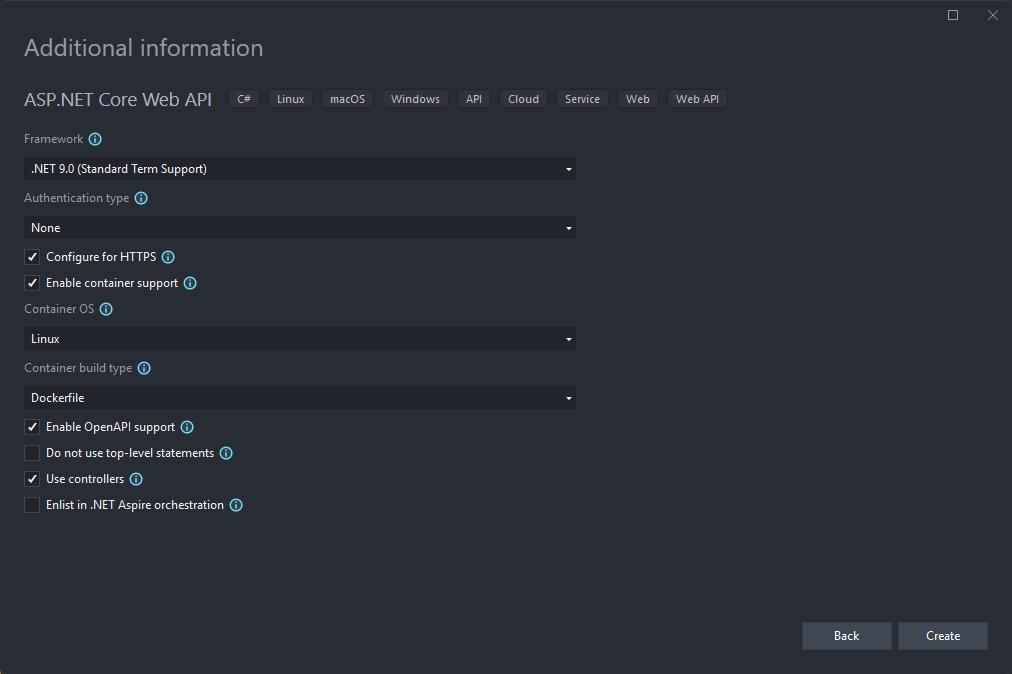
Create a new controller based Web API application:
In WeatherForecast controller you will see that ILogger is already resolved in constructor:
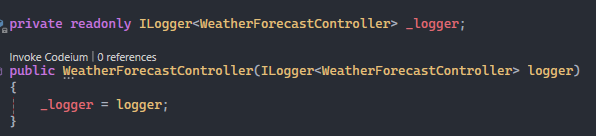
What is mandatory for ILogger interface is that you need to provide class name in generic placeholder (in this case, it is WeatherForecastController) because it provides context and makes it easier to filter, organize, and analyze logs.
Remove old code inside of Get method and add this:
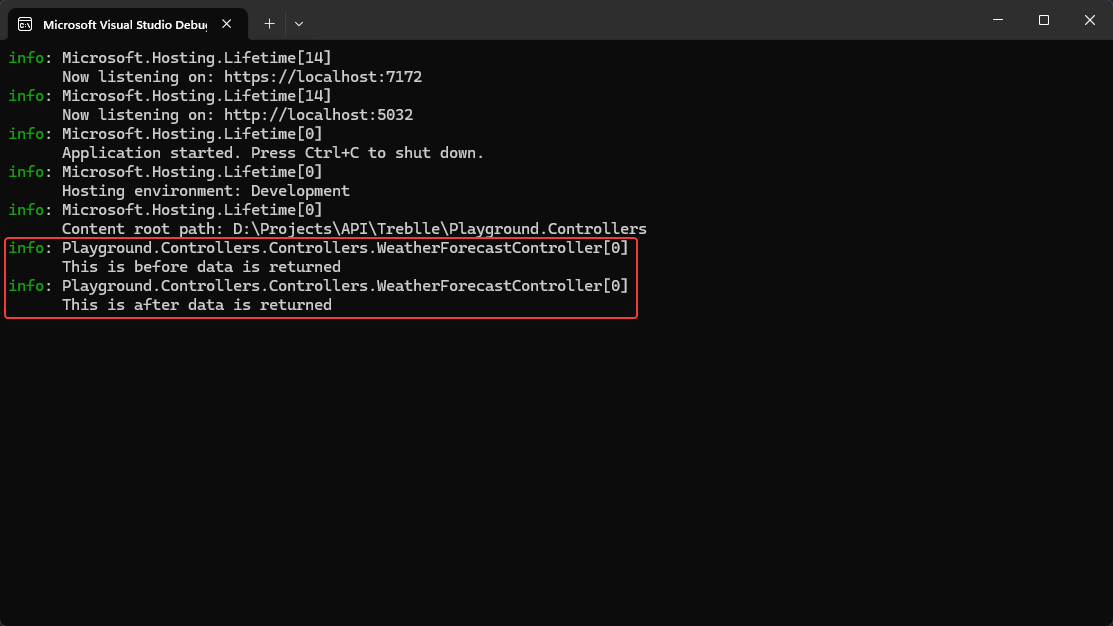
 _logger.LogInformation("This is before data is returned");

 WeatherForecast[] data = Enumerable.Range(1, 5).Select(index => new WeatherForecast
 {
     Date = DateOnly.FromDateTime(DateTime.Now.AddDays(index)),
     TemperatureC = Random.Shared.Next(-20, 55),
     Summary = Summaries[Random.Shared.Next(Summaries.Length)]
 })
 .ToArray();

 _logger.LogInformation("This is after data is returned");

 return data;
When you run the application, go to the console, and you should see newly added logs written inside:
But this approach has its drawbacks. Most notable is limited structured logging support, but others are:
- No support for log rotation
- No built in file logging
- Only default log message formatting available
In some of my projects, few limitations were showstoppers that forced us to look for alternatives. Then we introduced Serilog to our project, and until this day we stick to it in other projects.
What is Serilog?
It’s probably the most well known logging library in the .NET community. It provides a clean API for logging to files console or various formats known as sinks. But what is most characteristic for this library is, per their sites is:
Unlike other logging libraries, Serilog is built with powerful structured event data in mind.

As for setup and configuration, it’s pretty much straightforward. So let’s start.
Configuration
To start with Serilog, there are 2 packages that need to be added:
- Serilog.AspNetCore - it contains Serilog configuration for Asp.Net Core application
- Serilog.Formatting.Compact - compacted JSON event format for better performance
Next is setup in Program.cs switch and add the lines from the red square:
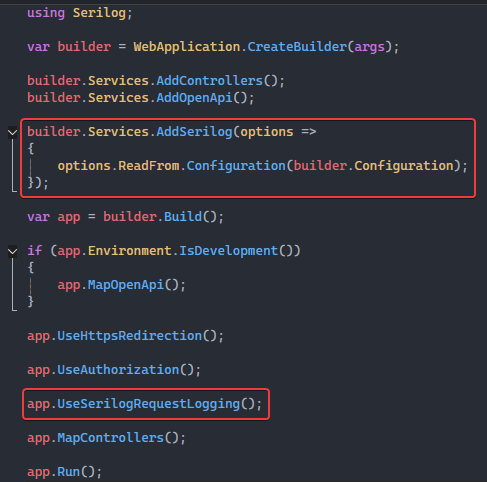
First two lines sets Serilog as the default logging provider and reads configuration from appSettings.json.
Third line register middleware that collects information during HTTP request and writes it to registered sink.
And that is all you have to do in Program.cs. To complete setup, you need to provide configuration in the appSettings.json file.
Open it, delete the whole Logging section and add this code:
 "Serilog": {
   "Using": [ "Serilog.Sinks.Console", "Serilog.Sinks.File" ],
   "MinimumLevel": "Information",
   "WriteTo": [
     {
       "Name": "Console"
     },
     {
       "Name": "File",
       "Args": {
         "path": "Logs/log.txt",
         "rollingInterval": "Day",
         "rollOnFileSizeLimit": true,
         "formatter": "Serilog.Formatting.Compact.CompactJsonFormatter, Serilog.Formatting.Compact"
       }
     }
   ],
   "Enrich": [ "FromLogContext", "WithThreadId", "WithMachineName" ]
 },
Configuration defines how Serilog should behave, including where logs should be written and the minimum log level to capture in few parts:
- Using: this section specifies Serilog sinks (destination for logs)
- Minimum level: minimum log level that Serilog will capture
- WriteTo: sinks configuration
- Enrich: extra information included in logs (threadId, machine name, etc.)
As you see, for Console sink there is no extra configuration, but for File there are a few things that need to be configured in Args section:
- path: the file path where logs will be written
- rollingInterval: Specifies how often a new log file is created (if value is "Day", a new log file will be created every day).
- rollOnFileSizeLimit: If true, a new log file will be created when the current file reaches a certain size limit (default size is 1Gb).
- formatter: Specifies the format of the log entries (use
CompactJsonFormatterfrom the to writes logs in a compact JSON format)
With this, the Serilog configuration is completed.
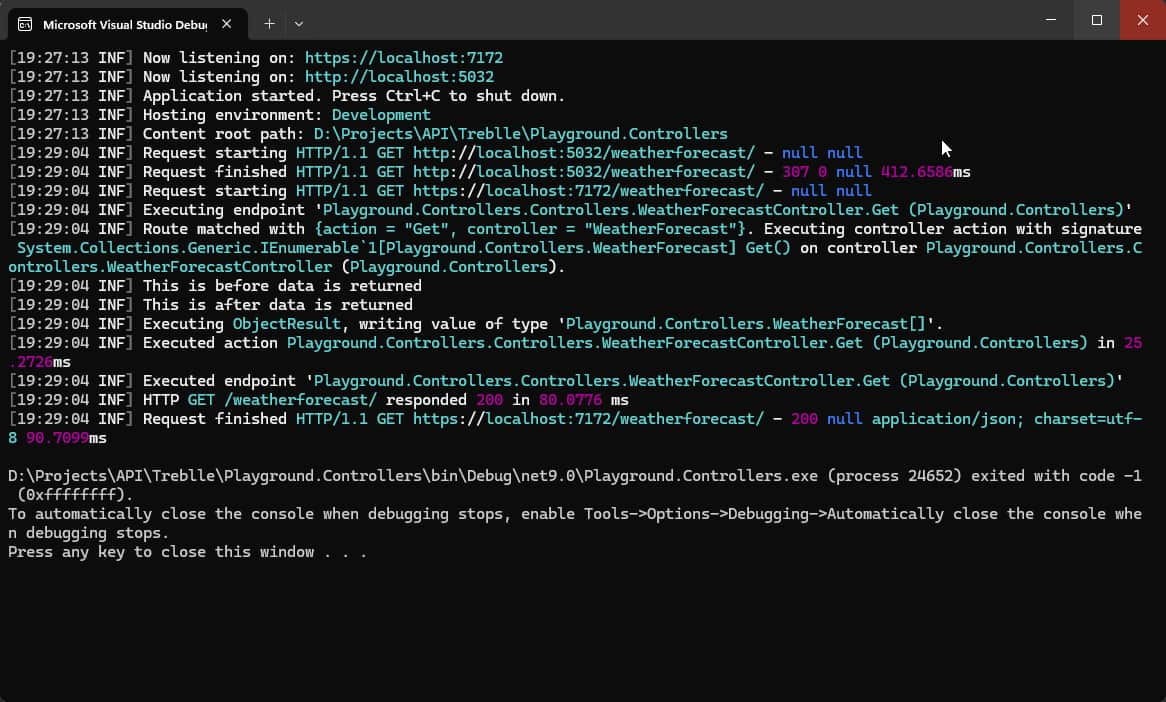
To be sure that everything is hooked up invoke the endpoint again. The console log should look like this:
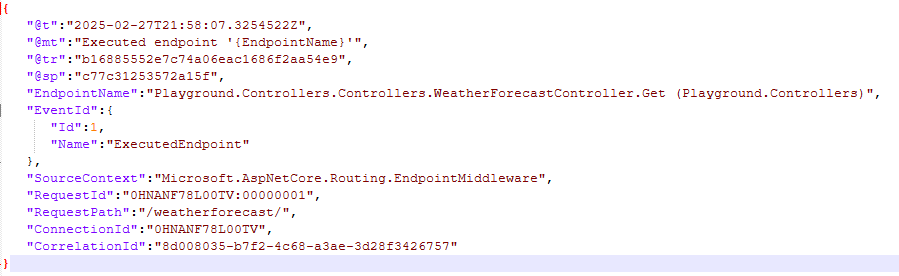
And if file setup is ok, you should see Logs folder with log{timestamp}.txt file inside with logs looking like this:
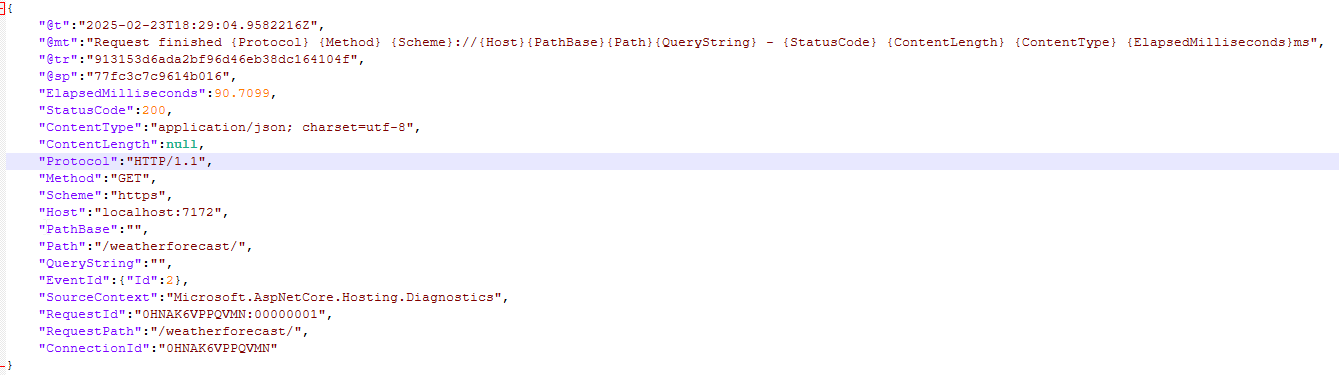
Much more readable and flexible than ordinary logs, right?
Make logs more “richer”
Sometimes your logs have to be enriched with more information than you got initially. A perfect example is correlation Id property. It’s a unique identifier that is assigned to each request that helps you track requests across different parts of the application.
The simplest way to add correlationId to the logs is through middleware. If you’re unfamiliar with how middleware works in ASP.NET Core, check out this guide on extending and optimizing your API with middleware.
Create a CorrelationIdMiddleware file and paste this code:
public class CorrelationIdMiddleware(RequestDelegate next) : IMiddleware
{
    public async Task InvokeAsync(HttpContext context, RequestDelegate next)
    {
        context.Response.Headers.TryGetValue("X-Correlation-Id", out StringValues correlationIdHeader);

        var correlationId = correlationIdHeader.FirstOrDefault() ?? Guid.NewGuid().ToString();

        using (LogContext.PushProperty("CorrelationId", correlationId))
        {
            await next(context);
        }
    }
}
Next thing is to register middleware in DI and then use it in request pipeline.
For DI registration:
builder.Services.AddTransient<CorrelationIdMiddleware>();And for middleware usage:
app.UseMiddleware<CorrelationIdMiddleware>();All new requests will now have correlationId attached:
Beyond logging
Knowing what is happening to your system is one of the key things you need to have in mind during the development. But that is only one part of observability features.
What if you want to have traces and metrics? You can go with OpenTelemetry. Or, a much simpler solution, with Treblle API Observability or API Analytics that allows you to observe your API from the dashboard you got out of the box.
Conclusion
In my opinion, logging is not just a “nice-to-have” feature—it’s an absolute must. Understanding how your application behaves in real-time is crucial for maintaining its reliability, performance, and security. For more insights into designing high-quality APIs, check out this article on best practices for building powerful .NET APIs.
Without proper logging, you’re essentially flying blind, unable to detect, diagnose, or prevent unwanted behavior when it occurs.